A Southern College
In the summer of 1770, fourteen-year-old Henry Lee Jr. arrived in Princeton to begin his freshman year at the College of New Jersey. His new home, Nassau Hall, was itself only fourteen years old at the time, and the college had seen approximately 350 students graduate since its founding. The majority of graduates hailed from New Jersey, Pennsylvania, or New York; only about a dozen students made the journey to Princeton from Lee’s birthplace in colonial Virginia. Two of these Virginians were still on campus, including future United States president James Madison (class of 1771).
Following his graduation in 1773, Lee returned to Virginia and fought in the Revolutionary War, earning the sobriquet “Light Horse Harry." Beginning in 1791, he served as the Governor of Virginia, and went on to represent his state in the United States Congress. In the meantime, three of his brothers—Charles Lee (‘1775), Richard Bland Lee (‘1779), and Edmund Jennings Lee (‘1792)—followed in his footsteps at Princeton. By the time his son, Robert E. Lee, took command of the Army of Northern Virginia in 1862, over 500 more Virginians had enrolled in the College of New Jersey. In the decades leading up to the Civil War, southern students often composed more than half of their graduating classes.[1]

Henry Lee, Jr. (class of 1773), Governor of Virginia and father of Robert E. Lee.
View Primary Sources
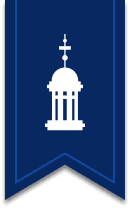
As historian Craig Wilder observes: “The pattern of recruitment and enrollment at New Jersey conformed to the geography of American slavery.” The number of southern students at Princeton began to climb in the 1760s and increased dramatically over the the next hundred years. President John Witherspoon, who arrived on campus in 1768, made a deliberate effort to target aristocratic planters in the lucrative slave colonies of British North America and the Caribbean. His 1772 Address to the Inhabitants of Jamaica yielded only a handful of students from the West Indies. But his fundraising forays into the southern colonies established a powerful precedent that would continue into the next century. Witherspoon’s influence helped to recruit Henry Lee and his three brothers and tripled the number of students enrolling from Virginia between 1770 and 1780. Prior to Witherspoon’s tenure, the number of southern students in a graduating class rarely exceeded 20%. By 1790, the proportion of southerners reached a high of 67%. From the time of his death in 1794 until the eve of the Civil War, that number never fell below 25%.[2]
Altogether, between 1746 and 1865, about 2,400 residents of the slaveholding South attended the College of New Jersey, representing seventeen states and territories and at least 40% of all alumni. An accurate analysis is difficult due to incomplete records, ambiguous location data, and differing definitions of “the South.” But the pattern is clear. By one account, between 1820 and 1860, southerners averaged 9% of the student body at Harvard and 11% at Yale. At Princeton, during the same period, the average was 36%—more than three times the number at peer institutions. If one includes all states south of the Mason-Dixon line, using the most recent data, the mean average is closer to 45%. Of course, the ratio of students originating from the South does not include the significant number of students who were born into slaveholding families in the North or who traveled to the South after graduation to work as tutors, establish schools, or pursue business. Born in Connecticut, Waightstill Avery (‘1766), spent his adult life managing a slave plantation in North Carolina. Born in Pennsylvania, David S. Kaufman (‘1833) became a fiery proslavery senator in the Republic of Texas.[3]
Looking back from the turn of the 20th century, Edward Shippen (‘1845) recalled a “preponderance of Southern students” on campus. Of the nine freshmen who enrolled in 1843, he noted that four came from Maryland, one from Washington D.C., two from Louisiana, one from Alabama, and only one from his home state of New Jersey. “Does anyone wonder that this was called a Southern College – and that, to some extent, we had Southern influences and ways,” Shippen concluded. “But few students ever come to Princeton from farther North than New York,” reads a college guidebook from 1853. “On the contrary nearly all the Southern states, even the most distant, are well represented.”[4]
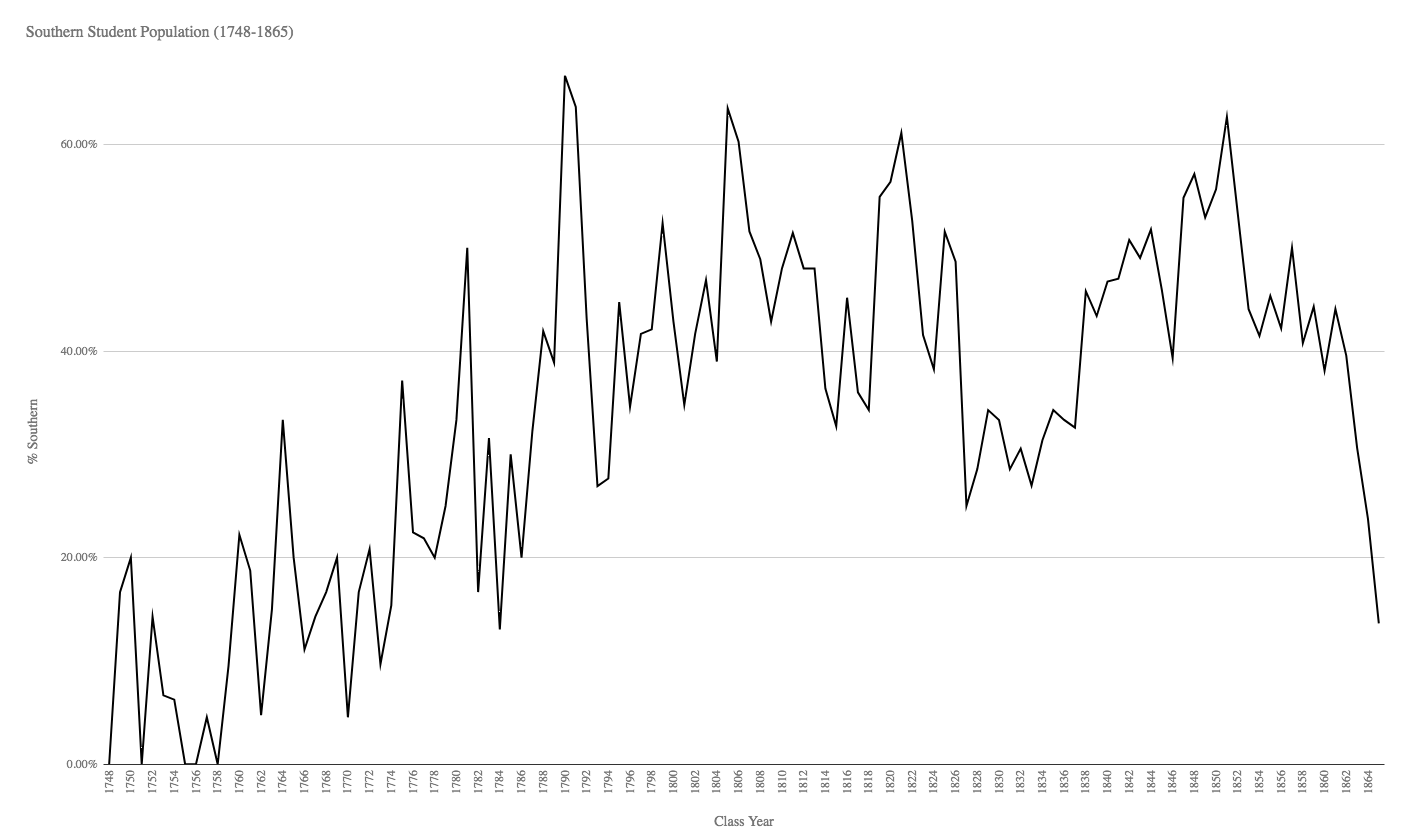
Between 1840 and 1860, eight graduating classes had more southern than northern students. The class of 1851, for example, consisted of forty-seven southern students, fourteen students from New Jersey, twelve from Pennsylvania, two from New York, and none from New England. The impact of these students helps to explain Princeton’s early embrace of colonization and rejection of abolition. At the same time, their influence is not easy to measure. Not all southerners came from large slaveholding families, and their career paths could be diverse. Kentuckian James G. Birney (‘1810) became a leading abolitionist. South Carolinian Jehu A. Orr (‘1849), on the other hand, became a member of the Confederate Congress.[5]
As the slave economy pushed westward along the cotton frontier, the population of southern students grew alongside it. Although Maryland and Virginia sent the largest total number of students, southerners matriculated from every state of what would become the Confederacy. When “Light Horse” Harry Lee graduated in 1773, his class included two other southern students, both from Maryland. When James Kendall Lee, his distant relative, graduated in 1849, his cohort included students from Maryland, Virginia, North Carolina, South Carolina, Georgia, Tennessee, Alabama, Mississippi, Louisiana, and Indian Territory (now Oklahoma). In his diary, James Kendall Lee noted frequent interactions, road trips, carousing, and adventures with his fellow Virginians and other self-described “southern bloods.” Twelve years later, like many of his classmates, he joined the Confederate army. Indeed, more Princeton alumni fought for the Confederacy than for the Union. James Kendall Lee, the last of the Virginian Lees to attend the school before the outbreak of the war, was shot and killed at the First Battle of Bull Run in the summer of 1861.[6]
Methodology
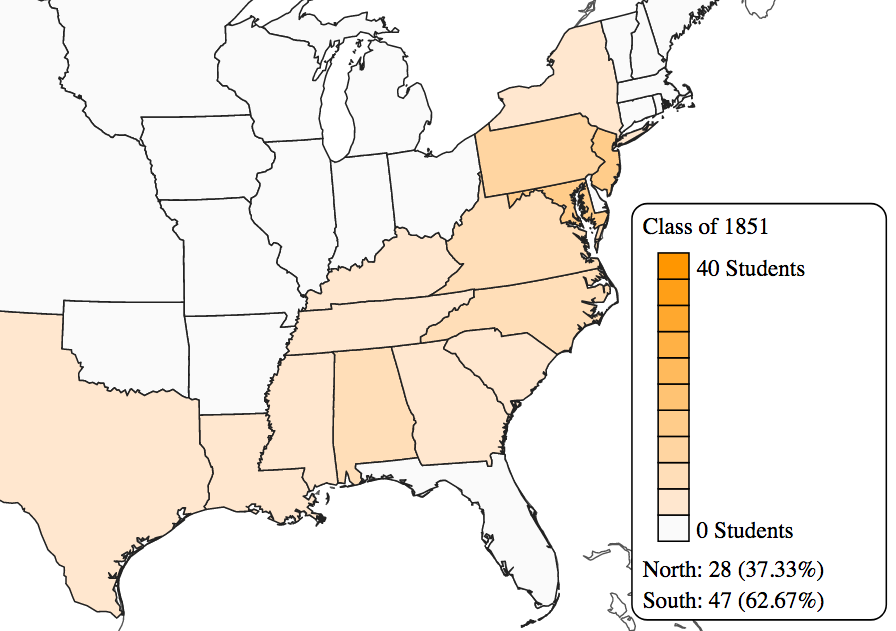
Beginning in 2016, Mudd Manuscript Library staff and Princeton & Slavery Project researchers constructed a database of every student who attended the College of New Jersey between its founding in 1746 and the end of the Civil War in 1865. The database draws on three main sources: the “Undergraduate Alumni Records” at Mudd Manuscript Library (AC104), Mudd’s “Non-Graduate Records” (AC299), and dozens of student catalogs printed during the 19th century. All of these sources suffer from missing, incomplete, or conflicting information—so a certain amount of educated guesswork was required.
The printed catalogues, available sporadically between 1805 and 1829 and in full for every year thereafter, are by far the most authoritative source. Since the catalogs list students’ home state alongside other members of their graduating class, the data for these years can be considered definitive. Wherever possible, information was cross-referenced against other extant sources, including the five volumes of Princetonians, published by Princeton University Press, which contain detailed biographical entries on nearly every student who matriculated between 1748 and 1794. The American Antiquarian Society’s Student, Teacher, and Trustee Database Project, which provides demographic statistics on a range of higher education institutions during the 19th century, was another invaluable reference point.
Antebellum Alumni Database
The student origins database is based on the undergraduate alumni index compiled by the Princeton University Archives. Efforts to organize and expand this data culminated in a hackathon in February 2016, which identified home states and other key demographic information for about 2,000 students. In Fall 2015, members of the Black Justice League consulted on the project and suggested an emphasis on concrete numbers and visualizations, which led to the development of the ratio chart and heat map. Work cleaning, researching, and verifying the student data continued for most of the following year. Over twenty Princeton undergraduates, graduate students, librarians, and staff members contributed to the project. The resulting list of 6,593 students is one of the largest and most comprehensive resources of its kind. In the interest of transparency and in order to promote future research, this database is available in full.
A comprehensive list of Princeton undergraduates, from the class of 1748 to the class of 1865. Data includes graduate status, state of origin, and state at death.
View Primary Sources
Unfortunately, as with any dataset of this magnitude, there will be errors, omissions, and duplications. Although every effort was made to correct these problems, a small margin of error is inevitable. A reliable place of origin could not be found for 491 students, or 7.45% of the total. (These are labeled “NF” in the database.) Students with ambiguous names or class years were left in place. Although American states are standardized as two-letter postal codes, foreign countries are listed as they appeared in the source. When listing place of origin, preference was afforded to the student’s address at the time of their matriculation rather than birthplace. In rare cases where a student’s reported place of origin differed from their known family residence, a decision was made based on the preponderance of primary source evidence.
Ratio of Northern to Southern Students
In order to determine the ratio of northern and southern students, additional manipulation and data cleaning was required. All students with ambiguous or non-existent class or location data were purged from the sample. All international students, including 17 students from the West Indies, also were removed. Altogether, this amounted to 571 entries, or about 8.66% of the total. As in the larger database, students were grouped according to their graduating class year. Students who did not graduate (about 35% of all students) were organized according to their anticipated graduation year. This means that, in many cases, the size of a class cohort is larger than the list of graduating seniors for that year. Although grouped together, not all members of a cohort were on campus at the same time.
An interactive chart showing the proportion of southern students in each graduating class, from the class 1748 to the class of 1865.
View Visualization
The question of who counted as a “northern” student and who counted as a “southern” student was not easy to answer. Most northern states contained significant slave populations prior to the 19th century, and despite its gradual emancipation laws New Jersey remained a slave state until 1865. Recent scholarship points to the close integration of slave and free economies during the antebellum period and results in a blurring of the traditional terms “North” and “South.”[7] Nevertheless, for the purposes of this study, the South was defined as any state or territory falling below the Mason-Dixon line (including Missouri and excluding Delaware). Although based on historical precedent, this distinction remains somewhat arbitrary, and readers should keep this in mind as they peruse the database, the statistics, and the charts and maps featured on this site.
Student Origins Heat Map
The student origins heat map is restricted to what is now the continental United States. Students who listed an address in the District of Columbia were included under the state of Maryland for mapping purposes only. As with the ratio data, students are grouped by graduating class year, and non-graduates are included under their anticipated year of graduation. The color gradients indicate the density of students originating from each state, and additional information is available by clicking on the state. The map is intended to illustrate the growth and geographic diversity of Princeton students alongside the growth of the nation. Users can track the spread of student enrollment, for example, as it developed in concert with the slave labor economy. By reproducing the territorial expansion of the United States, the map does not seek to elide the tremendous exploitation and violence that accompanied and underwrote that process.[8]
An interactive map of the origins of Princeton undergraduates, from the class of 1748 to the class of 1865.
View Visualization
About the Author
Joseph Yannielli received his PhD from Yale and was the Perkins Postdoctoral Fellow in the Princeton Humanities Council. His work focuses on the history of slavery and abolition, with a special focus on America, West Africa, and the wider world during the nineteenth century. His other areas of interest include political and social movements, missionaries and religion, capitalism and globalization, and the United States in the world. At present, he is completing a book about the Mendi Mission and the role of Africa in the American abolition of slavery. He was the first project manager and lead developer of the Princeton & Slavery Project website, as well as several other digital history projects.
View all stories by Joseph Yannielli »
References
[1]
Richard A. Harrison, Princetonians, 1769-1775: A Biographical Dictionary (Princeton, NJ: Princeton University Press, 1980), 301-308. Enrollment numbers can be found at: “Database of Princeton Students, 1748-1865," Database of Princeton Student Origins, Princeton & Slavery Project, accessed 16 October 2017, slavery.princeton.edu/sources/database-of-princeton-student-origins. For more information, please refer to the “Methodology” section below.
⤴
[2]
Craig Steven Wilder, Ebony & Ivy: Race, Slavery, and the Troubled History of America’s Universities (New York: Bloomsbury Press, 2013), 102-111, esp. 105; Richard A. Harrison, Princetonians, 1776-1783: A Biographical Dictionary (Princeton, NJ: Princeton University Press, 1981), xxviii-xxx.
⤴
[3]
Michael O’Brien, Conjectures of Order: Intellectual Life and the American South, 1810-1860, vol. 1 (Chapel Hill, NC: University of North Carolina Press, 2004), 29. For an alternate set of numbers, see Ronald D. Kerridge, “Answering ‘The Trumpet to Discord’: Southerners at the College of New Jersey, and their Careers” (BA thesis, Princeton University, 1984); Margaret Abruzzo, “‘A Humane Master–An Obliging Neighbor–A True Philanthropist’: Slavery, Cruelty, and Moral Philosophy,” Princeton University Library Chronicle 66 (Spring 2005): 494-495. On Waightstill Avery, see James McLachlan, Princetonians, 1748-1768: A Biographical Dictionary (Princeton, NJ: Princeton University Press, 1976), 543-545.
⤴
[4]
Edward Shippen, “Some Notes about Princeton,” ed. J. Jefferson Looney, Princeton University Library Chronicle 59 (Fall 1997): 32, 37; James Buchanan Henry and Christian Henry Scharff, College as It Is, or the Collegian’s Manual in 1853, ed. J. Jefferson Looney (Princeton, NJ: Princeton University Library, 2009), 247.
⤴
[5]
Thomas Wertenbaker argues that the experience of living in New Jersey made southern students “more cosmopolitan" and less partisan. He offers no evidence to support this claim. In fact, the opposite seems at least as likely. Thomas Jefferson Wertenbaker, Princeton, 1746-1896 (Princeton, NJ: Princeton University Press, 1996), 214.
⤴
[6]
Adam Rothman, Slave Country: American Expansion and the Origins of the Deep South (Cambridge, MA: Harvard University Press, 2005); James Kendall Lee, Diary, 1 January 1848 - 29 June 1849, Mss 5:1 L513:1, Virginia Historical Society (Richmond, VA); Edmund Jennings Lee, Lee of Virginia, 1642-1892: Biographical and Genealogical Sketches of the Descendants of Colonel Richard Lee (Philadelphia: Franklin Printing Company, 1895), 553-557.
⤴
[7]
L. Diane Barnes, Brian Schoen, and Frank Towers, eds., The Old South's Modern Worlds: Slavery, Region, and Nation in the Age of Progress (New York: Oxford University Press, 2011); Sven Beckert and Seth Rockman, eds., Slavery's Capitalism: A New History of American Economic Development (Philadelphia: University of Pennsylvania Press, 2016).
⤴